Blog
The Basics of Using Gridmon to Monitor your Viya Environment

Use Gridmon to Monitor your Viya Environment
Monitoring SAS Viya across a cluster of hosts can be a challenge. Many Viya processes run as a generic “cas” account, and it can be difficult to connect users’ Viya processes to the resources those processes consume on the hardware.
Enter Gridmon.
Gridmon is a terminal application which shows a real-time monitor of Viya jobs with their CPU, Memory, and Disk Usage across all the hosts in your Viya environment. Think of it as a more powerful Linux “top” command for Viya. Gridmon comes installed along with the rest of your Viya software, so there’s no need for additional installation or licensing. If you have Viya, you have this tool already.
How to Run Gridmon
To use gridmon, you will want to switch to a Linux account that has passwordless ssh to all hosts in your Viya cluster so that gridmon will be able to communicate appropriately with all the hosts. If your personal Linux account doesn’t have elevated sudo privileges, then the ideal account to use is the “cas” account. In addition to the passwordless ssh that this account already has, it will also give you the ability to manage (terminate) any Viya jobs running as the “cas” account.
To launch gridmon, log in to the host functioning as your CAS Controller and run the gridmon.sh command in the location as shown below.
Gridmon Views
There are 3 different views that you can switch between in the gridmon application. By default, gridmon will launch in the Jobs view. There are also the Machine view and the Disk view. To switch between these, just press the first letter of each view: “j” for Job, “m” for Machine, and “d” for Disk. These screenshots represent what typical usage for each of these views may look like. Keep in mind that gridmon provides real-time views that constantly refresh to provide a current picture of the environment and not just static points in time. Your view may vary depending on how your cluster is arranged and the number of CAS Workers.
Job View 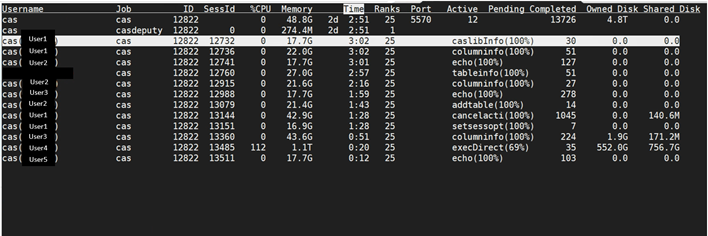
Machine View

Disk View

Exploring Gridmon Views
Job View
Gridmon launches into Job view by default which is good because it’s the most useful view of the environment. Let’s break down what we see on this screen.

- Most Viya jobs will run under the “cas” account from a Linux perspective, but gridmon will tie the process back to the Viya user whose session created the job as shown in parentheses.
- These 3 columns aren’t that useful, but they show the type of job (usually a CAS job as gridmon is a CAS job monitor), and IDs for sessions (which all link back to the ID of the CAS Controller)
- % CPU is the average CPU being used by the job across all the CAS Workers. (We’ll see later how this averaging works and how you can see the details about where the CPU load is occurring.)
- Memory is the total memory being used across all the workers for a given job.
- Time is the Real Time that a process has been running, shown in Hours:Minutes format. So, I know a job with a Time of 2:57 was started 2 hours and 57 minutes ago. This is not an indication for how much CPU time has elapsed. The job may, in fact, be idle, but this number will continue to increase.
- Ranks indicates how many servers the job is running on. The environment in my examples has 1 CAS Controller and 24 CAS Workers. Most jobs created by Viya applications (such as SAS Visual Analytics or Model Studio) will distribute jobs to all available workers to spread out the processing load. So, in the screenshot, you see the number 25 for most of these jobs. Jobs launched from SAS Studio code give the programmers more flexibility to designate their jobs to run on just a subset of the available CAS Workers.
- The Active column shows two different things depending on the Job. For the CAS Controller job (usually the oldest job, and it won’t have a SessID value), the Active value indicates how many total jobs are running at that moment, in this case, only 12. For all other CAS jobs, Active will show the last CAS action that ran along with a % complete value. I’ve found the % complete value to not be terribly accurate. I would interpret it as an indication as to whether a CAS action is complete or not, and not how close a job is to overall completion.
- The Completed column is a counter for how many CAS actions have been performed. The CAS Controller job keeps a running total for all jobs. And all other jobs keep the total CAS actions run by only that job.
- The Owned Disk and Shared Disk columns indicate how much disk the job is using. Owned Disk refers to the amount of CAS_DISK_CACHE being used across all the CAS workers.
You can sort these columns using your left and right arrow keys. Press the arrows until you highlight the column you want to sort on. This screen has been sorted by the Time column. (It will sort automatically when highlighted.)
From the screenshot above, we can see that there is a job using 112% CPU. Let’s explore what that means.
We can arrow down until we highlight the job and press Enter. This will bring up a menu of options. We can do several things on this menu, including terminating the job on all the hosts. (Be careful when killing jobs as the “cas” user as you could kill the CAS Controller process and take down your Viya environment.)
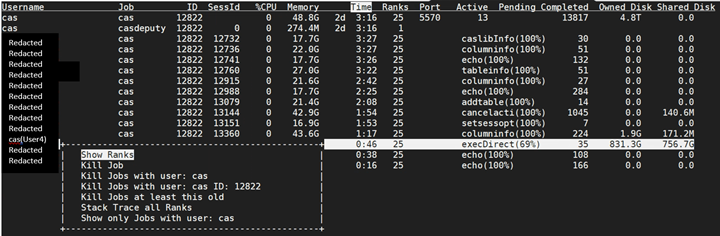
We want to select Show Ranks from this menu. As mentioned in the previous section, Ranks refers to all the servers on which a job is running. So when we click this option, we will see stats on this job for each host in the environment. This gives us a better picture on how the 112% CPU average is actually distributed.

We can see that, even though the Ranks shows that the job is running on all 25 hosts, most of the active CPU utilization is on just two of them, CAS Workers 6 and 10. There are 32 cores on these CAS Workers, so the Max CPU % is around 3,200% for each Worker. So, even though a job looks like it might be innocuously running with a low % CPU average, all or most of that computing could be on a single CAS Worker, making it perform more slowly compared to the rest of the idle CAS Workers.
We can also use our arrow keys to highlight specific CAS Workers such as Worker 6 and press Enter. From this menu there are a lot of options that I won’t get into here, but if we select Show Details, we can see the PID for the job on that Worker. This is the same PID you’d be able to find on the server with a “ps -ef | grep ######” command.


Machine View
The Machine view is the next most useful view in gridmon. By pressing the “m” key you will get a view somewhat similar to what we see below, CAS Controller followed by the list of CAS Workers. This will show a live total CPU load on each CAS Worker.
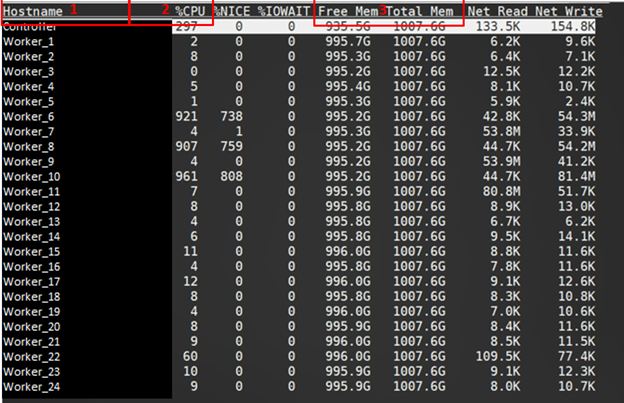
- Hostname shows the server name for each host in your environment. In my example, I’m using “Controller” and “Worker_N” to represent these hosts by their function. Yours will simply show the host name.
- % CPU is the sum of CPU utilization across all the cores on that host. In my example the max would be 3,200% because there are 32 cores on each box.
- Free Mem and Total Mem are exactly as indicated by their header. This is an easy place to see the memory status on any of the hosts in your environment.
As on the Job view, you can use the arrow keys to highlight specific hosts and press Enter to see a menu of options.


The Details on the host show the CPU stats and IOW for each core on that host.
Disk View
By pressing “d” you will switch to Disk View, probably the least useful of the views in gridmon. The results are highly dependent on the filesystems available to your hosts. I don’t have much use for this view except to monitor the CAS_DISK_CACHE usage. It’s not spelled out for you in gridmon, but your CAS_DISK_CACHE will be pointed to a storage location as defined in your environment configuration. You can see the sum of that space across all the hosts in the environment and see the usage stats.
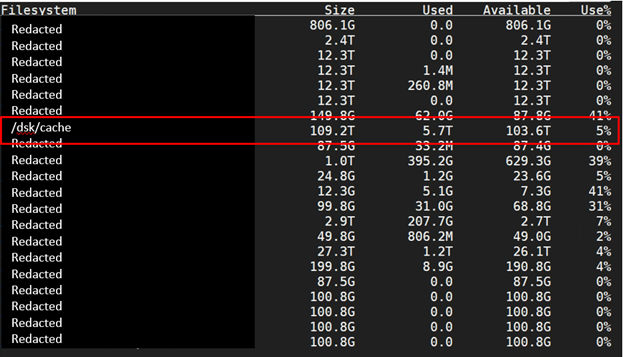
Having configured the CAS_DISK_CACHE on this environment, I know that it is pointed to what’s labeled as /dsk/cache. From this view, I can see that only 5% of that cache is used at the moment.
This is only a brief overview of the gridmon tool, but it gives you a starting point. Using the various views, this tool can help you effectively bridge the gap between what you see in Viya’s Environment Manager and what you see in linux centric tools like Top or Nmon.